Performance Benchmarks
This page records a reproducible OpenQuantumSim performance baseline. The numbers below are not a universal leaderboard; they document one hardware and software configuration so future benchmark results can be compared against the same reference point.
Benchmark Environment
Item |
Value |
|---|---|
Date |
2026-05-22 |
OpenQuantumSim commit |
startup optimization snapshot |
CPU |
Apple M1 |
Logical CPU count |
8 |
Platform |
macOS 26.4.1 arm64 |
Python |
3.14.3 |
Julia backend runtime |
1.11.9 through JuliaCall |
|
1.12.5 |
OpenQuantumSim |
0.1.0a2 |
QuTiP |
5.2.3 |
NumPy / SciPy / h5py |
2.4.4 / 1.17.1 / 3.16.0 |
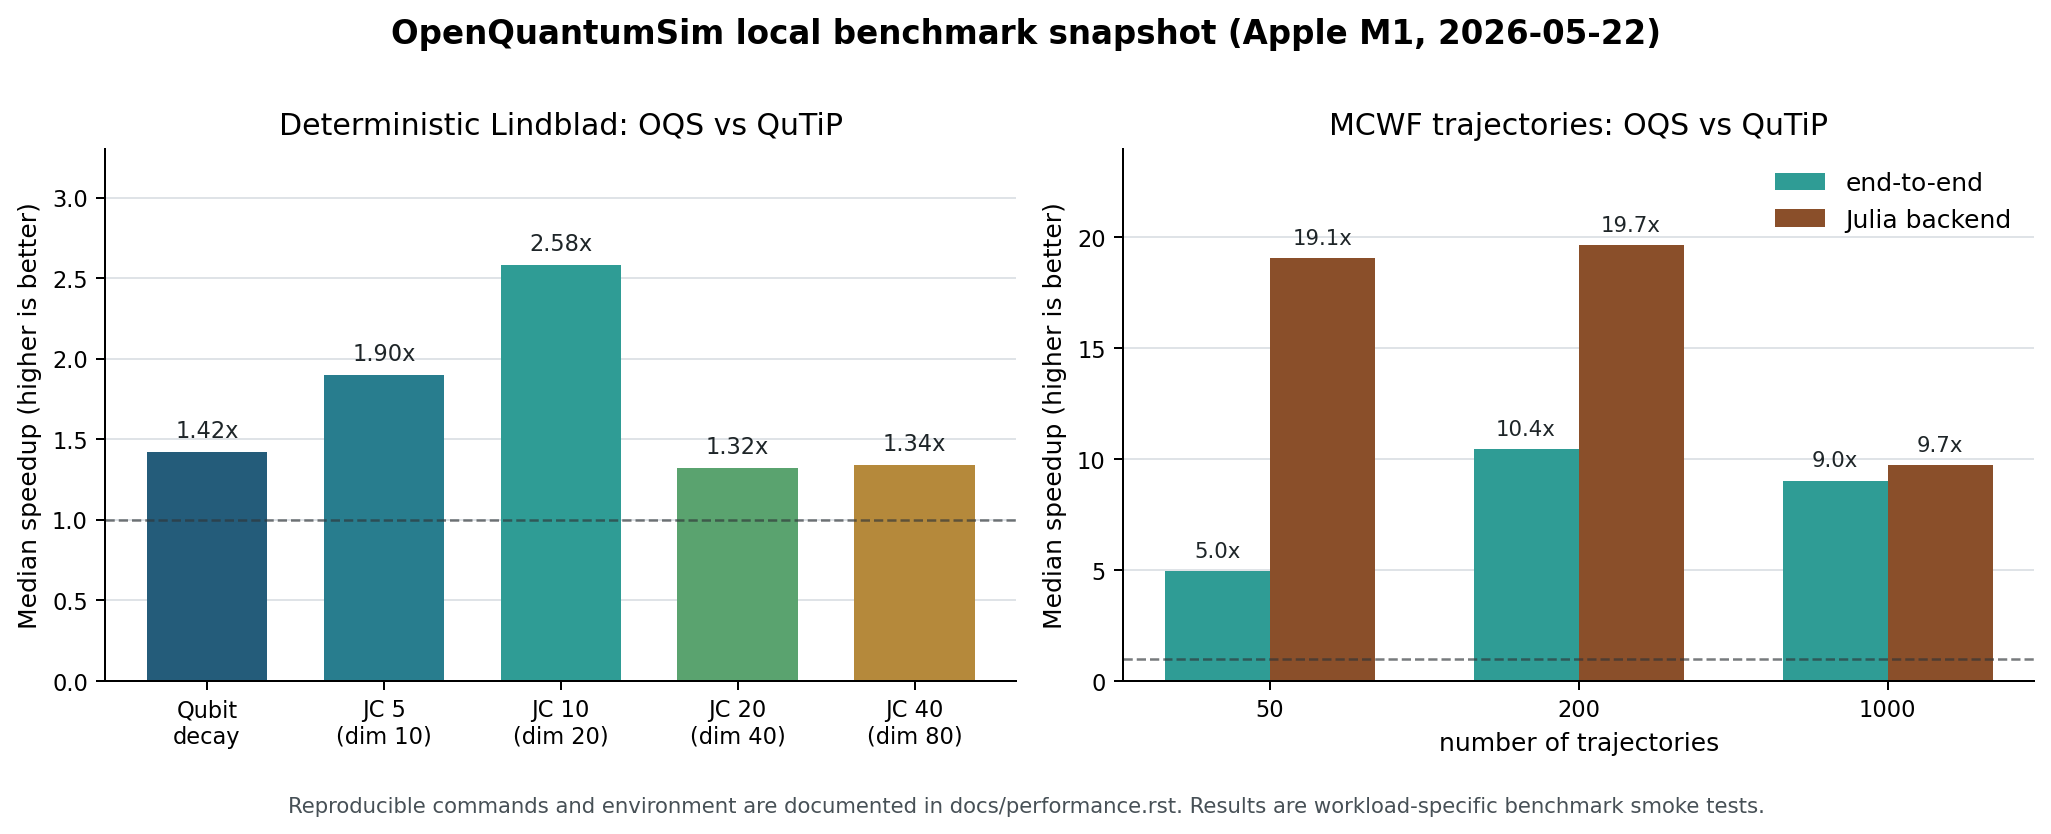
Deterministic Solver: OpenQuantumSim vs QuTiP
Command:
MPLCONFIGDIR=/private/tmp/oqs-mpl \
python benchmarks/bench_vs_qutip.py \
    --repeats 5 \
    --time-points 81 \
    --t-final 6.0 \
    --cases qubit jc5 jc10 \
    --oqs-methods auto krylov ode \
    --json runs/benchmarks/bench_vs_qutip_after_stats.json
Settings: rtol=1e-8, atol=1e-10. OpenQuantumSim used the default
single-threaded backend process for this deterministic benchmark.
Case |
Dimension |
QuTiP median |
OQS auto median |
Best OQS median |
OQS auto vs QuTiP |
Max expectation delta |
|---|---|---|---|---|---|---|
Qubit decay |
2 |
1.43 ms |
1.00 ms |
0.77 ms ( |
1.42x |
7.49e-09 |
Jaynes-Cummings 5 |
10 |
2.18 ms |
1.14 ms |
1.14 ms ( |
1.90x |
1.21e-09 |
Jaynes-Cummings 10 |
20 |
6.71 ms |
2.60 ms |
2.08 ms ( |
2.58x |
7.23e-09 |
Interpretation: after reducing solver-stat conversion overhead at the
Python-Julia boundary, OpenQuantumSim is faster than QuTiP for these small
deterministic benchmark cases on this machine. Expectation values agree with
QuTiP at about 1e-9 to 1e-8.
Python Wrapper Profile
The main small-system bottleneck was not the Julia integrator. It was repeated
Python-side probing of optional fields in the Julia NamedTuple used for
Result.solver_stats. The conversion now uses the fields reported by
dir(...) and avoids exception-heavy lookups for fields that are not present.
Profile |
Workload |
Python-visible cumulative time |
Solver-stat conversion time |
|---|---|---|---|
Before |
100 warm qubit-decay |
0.671 s |
0.601 s |
After |
100 warm qubit-decay |
0.050 s |
0.007 s |
Backend Startup Profile
Command:
PYTHON_JULIACALL_HANDLE_SIGNALS=yes python - <<'PY'
import time
import numpy as np
import openquantumsim as oqs
from openquantumsim._julia_bridge import get_julia, load_backend

started = time.perf_counter(); get_julia()
print("get_julia", time.perf_counter() - started)
started = time.perf_counter(); load_backend()
print("load_backend", time.perf_counter() - started)

space = oqs.SpinSpace(0.5, label="atom")
psi = oqs.basis(space, "up")
H = 0.0 * oqs.sigmaz(space)
c = np.sqrt(0.35) * oqs.sigmam(space)
e = oqs.Operator(oqs.ket2dm(psi), space, "P_excited")
t = np.linspace(0.0, 1.0, 11)

started = time.perf_counter()
oqs.mesolve(H, oqs.ket2dm(psi), t, c_ops=[c], e_ops=[e])
print("first_mesolve", time.perf_counter() - started)
PY
The profile below measures a fresh Python process after the Julia backend has
already been set up once. Normal runtime loads now skip Pkg.instantiate()
unless loading the backend fails; oqs setup-julia still forces
instantiation for installation validation.
Profile |
|
|
|
First |
Total |
|---|---|---|---|---|---|
Before |
0.786 s |
2.602 s |
11.337 s |
7.775 s |
22.500 s |
After |
0.334 s |
3.005 s |
6.139 s |
7.816 s |
17.294 s |
The same change also suppresses routine Julia package-manager output during normal solver calls.
Local Sysimage Startup
For repeated solver sessions, oqs build-sysimage compiles the packaged Julia
backend into a local sysimage and validates it with a fresh JuliaCall process
before it is registered for automatic reuse.
Command:
python benchmarks/bench_startup_sysimage.py \
    --install-local . \
    --repeats 1 \
    --json runs/benchmarks/bench_startup_sysimage_0.1.0a5_m1_2026-05-27.json
Apple M1, Python 3.14.3, Julia 1.11.9, single Julia thread:
Profile |
|
|
First |
Total |
|---|---|---|---|---|
Cold, no setup |
17.465 s |
20.773 s |
20.336 s |
72.315 s |
Warm, no sysimage |
2.301 s |
10.407 s |
13.711 s |
26.940 s |
Warm, validated sysimage |
4.756 s |
3.570 s |
3.894 s |
12.767 s |
The sysimage build took 692.064 s and produced a 543 MB image on this machine. The warm sysimage profile was 2.1x faster end-to-end than warm startup without a sysimage, with the first solver call itself 3.5x faster.
Larger Deterministic Spot Checks
Command:
MPLBACKEND=Agg PYTHON_JULIACALL_HANDLE_SIGNALS=yes \
python benchmarks/bench_vs_qutip.py \
    --repeats 3 \
    --time-points 81 \
    --t-final 6.0 \
    --cases jc20 jc40 \
    --oqs-methods auto ode krylov \
    --json runs/benchmarks/bench_vs_qutip_larger_startup_patch.json
Case |
Dimension |
QuTiP median |
OQS auto median |
Best OQS median |
OQS auto vs QuTiP |
Max expectation delta |
|---|---|---|---|---|---|---|
Jaynes-Cummings 20 |
40 |
3.91 ms |
2.95 ms |
2.95 ms ( |
1.32x |
1.96e-08 |
Jaynes-Cummings 40 |
80 |
13.93 ms |
10.38 ms |
8.52 ms ( |
1.34x |
4.71e-08 |
Monte Carlo Wave Functions: OpenQuantumSim vs QuTiP
Command:
PYTHON_JULIACALL_HANDLE_SIGNALS=yes JULIA_NUM_THREADS=4 \
python benchmarks/bench_mcsolve_vs_qutip.py \
    --n-traj 50 200 1000 \
    --time-points 31 \
    --t-final 2.0 \
    --max-step 0.02 \
    --repeats 3 \
    --json runs/benchmarks/bench_mcsolve_vs_qutip_m1_2026-05-22.json
Settings: spontaneous-emission qubit, gamma=0.35, one excited-state
projector, QuTiP mcsolve with progress disabled, OpenQuantumSim mcsolve
with n_jobs=-1 and four Julia threads.
Trajectories |
QuTiP median |
OQS median |
OQS backend wall time |
Workers |
OQS vs QuTiP |
OQS backend vs QuTiP |
|---|---|---|---|---|---|---|
50 |
8.85 ms |
1.79 ms |
0.46 ms |
4 |
4.96x |
19.06x |
200 |
33.58 ms |
3.22 ms |
1.71 ms |
4 |
10.44x |
19.67x |
1000 |
168.01 ms |
18.60 ms |
17.25 ms |
4 |
9.03x |
9.74x |
Interpretation: for this MCWF smoke benchmark, threaded backend-side aggregation gives OpenQuantumSim a clear trajectory-throughput advantage over QuTiP after backend warmup. The exact speedup is workload-specific and should be re-measured for larger Hilbert spaces and more expensive observables.
Monte Carlo Wave Function Scaling
Command:
JULIA_NUM_THREADS=4 MPLCONFIGDIR=/private/tmp/oqs-mpl \
python benchmarks/bench_mcsolve.py \
    --n-traj 200 \
    --time-points 31 \
    --t-final 2.0 \
    --max-step 0.02 \
    --repeats 3 \
    --warmup-trajectories 10 \
    --n-jobs 1 -1 \
    --json runs/benchmarks/bench_mcsolve_m1_2026-05-14.json
|
Workers |
Threaded |
Median elapsed |
Backend wall time |
Speedup vs serial |
Max expectation delta |
|---|---|---|---|---|---|---|
1 |
1 |
False |
6.595 ms |
3.868 ms |
1.00x |
1.00e-02 |
-1 |
4 |
True |
4.092 ms |
1.542 ms |
1.61x |
1.00e-02 |
Interpretation: backend-side trajectory aggregation and threading work. The small benchmark shows useful scaling, though the wall time is still heavily affected by Python-call overhead at this size. Larger trajectory counts should give a clearer measure of Julia-side scaling.
Dicke Mutual-Information Batch Runner
Command:
JULIA_NUM_THREADS=1 MPLCONFIGDIR=/private/tmp/oqs-mpl \
python examples/dicke/bench_mi.py \
    --N 4 \
    --kappa 0.1 \
    --n-traj 12 \
    --time-points 21 \
    --t-final 0.2 \
    --max-step 0.02 \
    --batch-size 2 \
    --repeats 2 \
    --warmup-trajectories 1 \
    --n-jobs 1 2 \
    --target-n-traj 1000 \
    --json runs/benchmarks/bench_dicke_mi_m1_2026-05-14.json
|
Workers |
Median elapsed |
Trajectories / s |
Seconds / trajectory |
Speedup vs serial |
|---|---|---|---|---|---|
1 |
1 |
0.0836 s |
143.46 |
0.0070 |
1.00x |
2 |
2 |
19.7627 s |
0.607 |
1.6469 |
0.004x |
Interpretation: this small Dicke MI benchmark exposes process-startup overhead. Each short-lived worker initializes its own Julia backend, so process parallelism is slower for small batches. Larger batches better amortize startup costs.
Reproducing Results
The raw JSON outputs are generated under runs/benchmarks/ and are ignored by
Git. Re-run the commands above to regenerate the local benchmark artifacts.